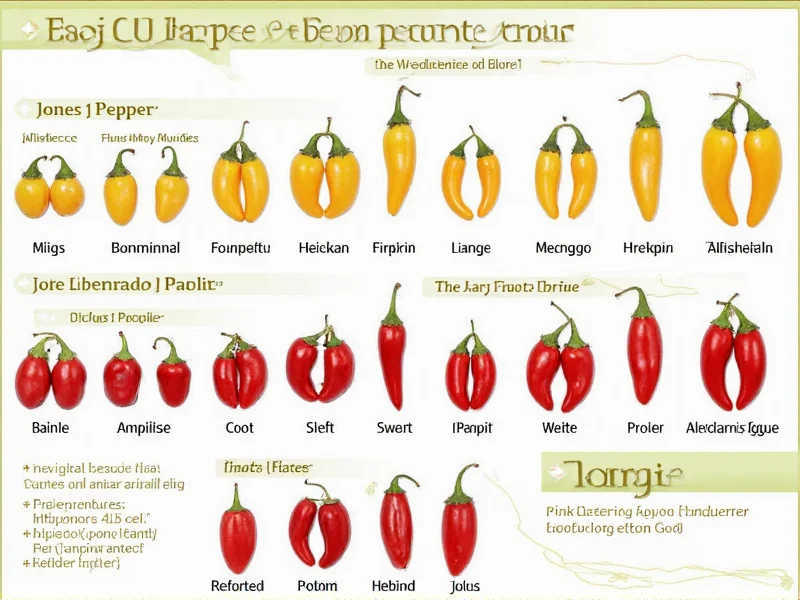
Understanding pepper varieties through visual identification remains crucial for culinary professionals, home gardeners, and food enthusiasts. Pepper picture charts provide immediate visual reference that helps users distinguish between similar-looking varieties, anticipate heat levels, and select appropriate peppers for specific recipes or growing conditions. These reference tools bridge the gap between botanical classification and practical kitchen or garden application.
Why Visual Pepper Identification Matters
Peppers belong to the Capsicum genus, which includes numerous species and thousands of cultivars. Many varieties look remarkably similar when immature but develop distinctive characteristics as they mature. A comprehensive pepper picture chart addresses common identification challenges by showcasing:
- Color progression from green to final ripe stage (red, yellow, orange, purple, or brown)
- Shape variations including blocky, tapered, elongated, or wrinkled forms
- Size comparisons across similar varieties
- Stem and calyx characteristics that distinguish species
- Internal structure showing seed patterns and flesh thickness
Major Pepper Categories in Identification Charts
Effective pepper picture charts organize varieties into logical categories that reflect both botanical relationships and practical usage. The primary divisions include:
Sweet Peppers (Non-Pungent)
These Capsicum annuum varieties contain negligible capsaicin. Bell peppers represent the most familiar type, but numerous specialty sweet peppers exist with distinctive shapes and colors. Charts typically show their complete color progression from immature green to fully ripe stages.
Hot Peppers (Pungent)
Ranging from mildly spicy to extremely hot, these varieties contain capsaicinoids that produce heat sensations. Charts organize them by heat level using the Scoville scale, with visual indicators showing how appearance correlates with heat potential.
| Pepper Variety | Scoville Heat Units | Color Range | Size (Length) | Common Culinary Uses |
|---|---|---|---|---|
| Bell Pepper | 0 SHU | Green, red, yellow, orange, purple | 3-4 inches | Raw salads, stuffed dishes, stir-fries |
| banana pepper | 0-500 SHU | Yellow, red, orange | 4-7 inches | Pickling, sandwiches, salads |
| jalapeño | 2,500-8,000 SHU | Green, red | 2-3.5 inches | Salsas, nachos, poppers, pickled |
| serrano | 10,000-23,000 SHU | Green, red, orange, yellow | 1-2.5 inches | Fresh salsas, hot sauces, guacamole |
| cayenne | 30,000-50,000 SHU | Red | 4-6 inches | Dried powders, hot sauces, spice blends |
| habanero | 100,000-350,000 SHU | Orange, red, yellow, chocolate | 1-2.5 inches | Hot sauces, Caribbean cuisine, preserves |
| ghost pepper | 855,000-1,041,427 SHU | Red, yellow, chocolate | 2-3 inches | Extreme hot sauces, competitive eating |
Interpreting Scoville Heat Units on Pepper Charts
The Scoville scale measures capsaicin concentration, but visual characteristics often correlate with heat potential. Pepper picture charts help users recognize visual indicators of heat:
- Shape: Pointed, tapered peppers generally indicate higher heat than blocky varieties
- Surface texture: Wrinkled or bumpy skins often signal increased heat levels
- Size: Smaller peppers within a variety often pack more concentrated heat
- Color: For some varieties (like habaneros), color indicates maturity rather than heat level
- Stem characteristics: Certain hot pepper varieties have distinctive stem shapes visible in detailed charts
Understanding these visual cues helps users make informed decisions without needing specialized equipment to measure heat levels directly. A comprehensive visual pepper identification chart serves as both educational tool and practical reference for selecting appropriate peppers based on appearance alone.
Practical Applications of Pepper Identification Charts
Gardeners benefit from pepper picture charts when selecting varieties for cultivation. The charts help distinguish between similar-looking seedlings and predict final fruit characteristics. Many charts include growing season information and preferred climate conditions alongside visual references.
Chefs and home cooks use these charts to substitute peppers when specific varieties aren't available. By understanding visual similarities between peppers with comparable heat levels, cooks can maintain recipe integrity even with ingredient substitutions. A detailed types of peppers with pictures guide prevents culinary disasters from accidentally using extremely hot peppers in place of mild varieties.
Food safety professionals utilize pepper identification charts to prevent mislabeling in commercial settings. Proper visual identification ensures accurate labeling of heat levels, protecting consumers with capsaicin sensitivities. These charts serve as training tools in food service environments to standardize pepper knowledge across staff members.
Creating Effective Pepper Reference Materials
The most useful pepper picture charts follow specific design principles that maximize their educational value:
- Life cycle representation: Showing peppers at multiple maturity stages, not just the final ripe form
- Scale indicators: Including measurement references to accurately represent size
- Cross-section views: Displaying internal structure, seed patterns, and flesh thickness
- Color accuracy: Using true-to-life color representation rather than stylized illustrations
- Comparative layouts: Positioning similar varieties side-by-side for direct visual comparison
Digital pepper identification resources often include interactive elements like heat level sliders, substitution suggestions, and regional availability information. The best visual reference guides combine photographic accuracy with practical usage information, creating truly valuable pepper varieties heat scale chart resources.
Using Pepper Charts for Culinary Success
When incorporating peppers into recipes, understanding visual identification prevents common mistakes. For example, red bell peppers and red cherry peppers may look similar to untrained eyes, but their heat levels differ dramatically. A comprehensive chili pepper identification guide helps cooks recognize subtle visual differences that indicate significant flavor and heat variations.
Professional kitchens often laminate pepper picture charts for quick reference during prep work. These visual aids help maintain consistency in dishes that rely on specific pepper varieties. Home cooks can create their own reference system by taking photos of purchased peppers at different stages for future identification.


 浙公网安备
33010002000092号
 浙B2-20120091-4